IONIZATION OF ATOMIC SYSTEMS IN STRONG FIELDS
Calculation of ionization rates for atoms in a strong static electric field
Numerical methods
- Complex rotation (CR) method [1];
- Solving the time-dependent Schroedinger equation (TDSE) [2].
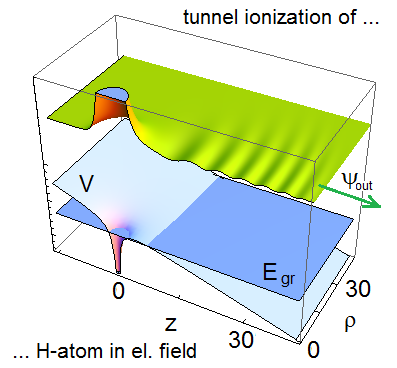
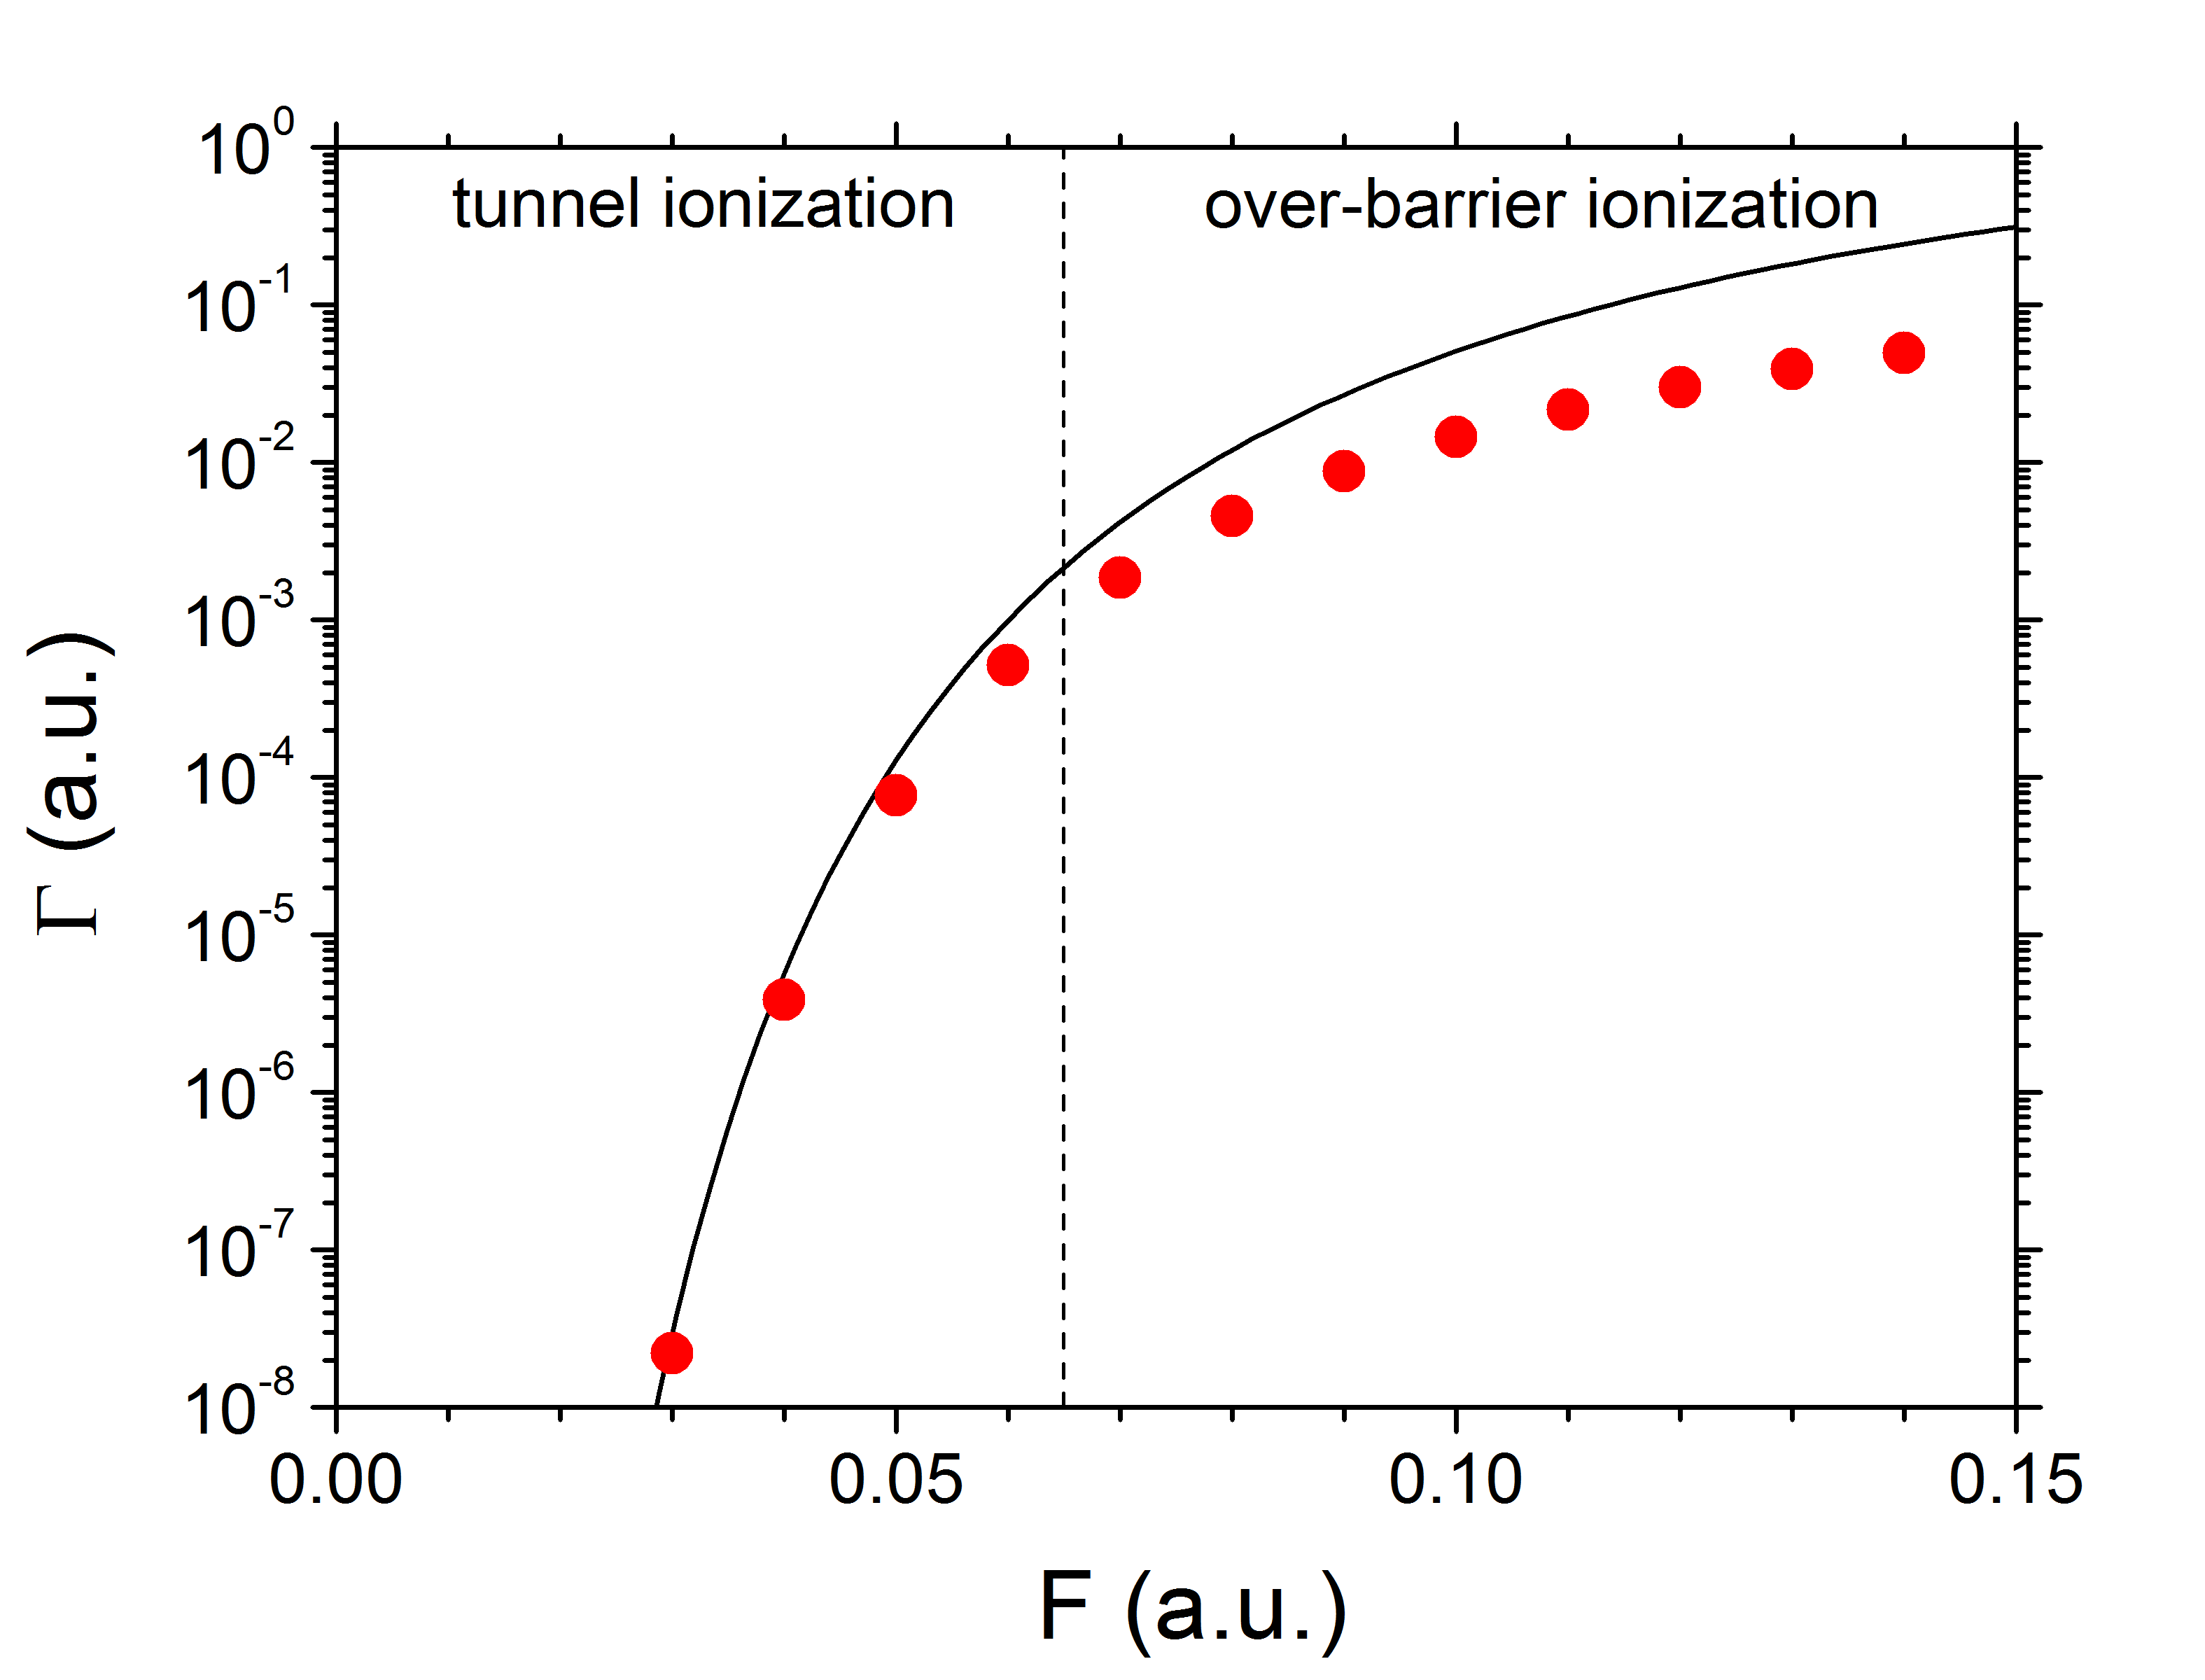
Hydrogen
Sodium
Results for sodium are published in Refs. [1] and [2].
Calculation of momentum distribution of photoelectrons at ionization of sodium atoms by a femtosecond laser pulse
Experiment [N. A. Hart et al, Phys. Rev A 93, 063426 (2016)]
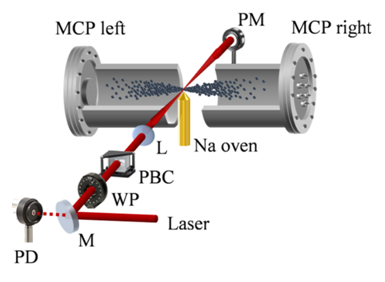
Photoionization of sodium atoms by a femtosecond laser pulse. The experimental setup: A steering mirror (M), half-wave plate (WP), polarizing beam-splitter cube PBC, lens (L), sodium oven, and power meter (PM) are shown along the beam path. A photodiode triggers the acquisition of electron counts from the chevron microchannel plates (MCP).
Energy scheme and the photoionization channels
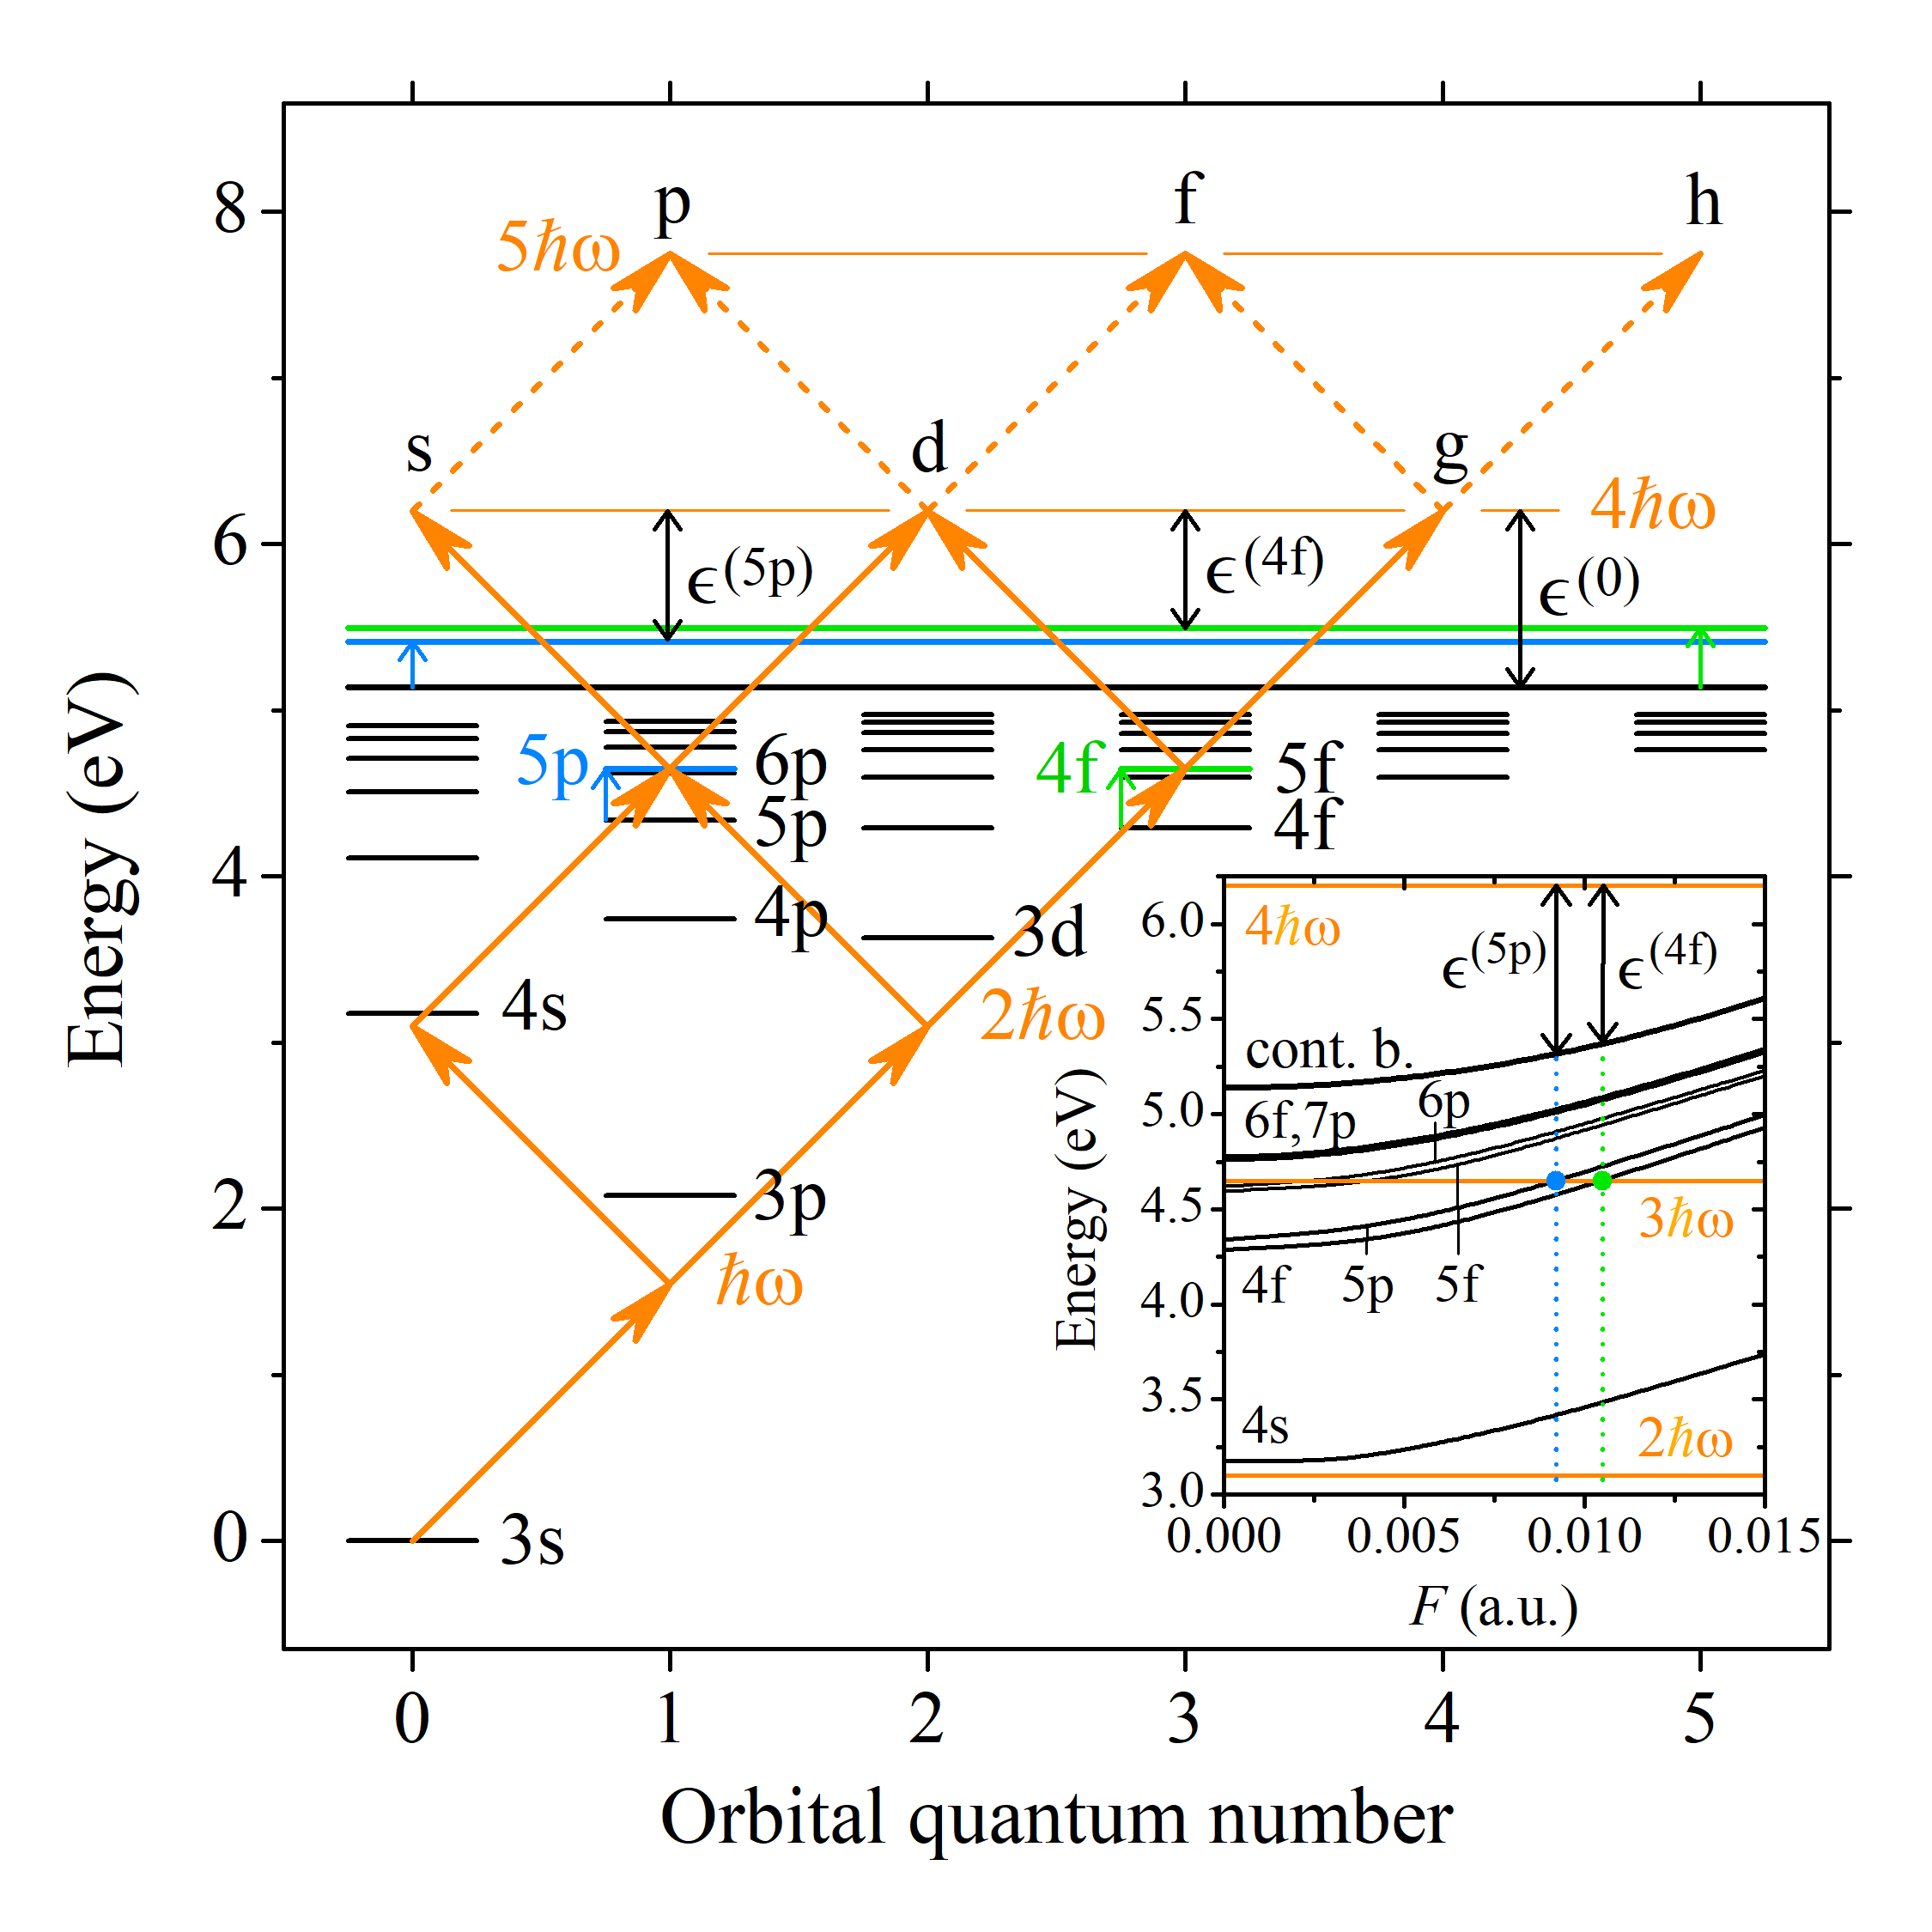
Energy scheme showing the energy levels (short black lines) corresponding to singly excited states of sodium relative to its ground state (3s) and possible 4-photon and 5-photon absorption pathways (orange arrows) from the ground state to continuum for the radiation of 800 nm wavelength (ħω = 0.057 a.u. = 1.55 eV). The dynamic Stark shift of several lowest levels and that of the continuum boundary as functions of the laser field strength (its electric component) F is shown in the inset. Levels 5p and 4f, which are at field strengths F = 0.0092 a.u. and 0.0105 a.u. shifted into the three photon resonance with the laser field [3], are represented by the blue and green short lines (dots in the inset), respectively. The continuum boundary at these two values of F and in the weak field limit is in the main plot represented by horizontal blue, green and black lines, respectively. The energies of photoelectrons produced at the 4-photon ionization in the weak-field limit are denoted by ϵ(0). The energies of photoelectrons generated at the resonantly enhanced multiphoton ionization (REMPI) via the intermediate states 5p and 4s are denoted by ϵ(5p) and ϵ(4s), respectively.
Numerical simulation
Method: Calculation of the evolution of atomic ground state under the influence of laser pulse by solving the corresponding TDSE [3].
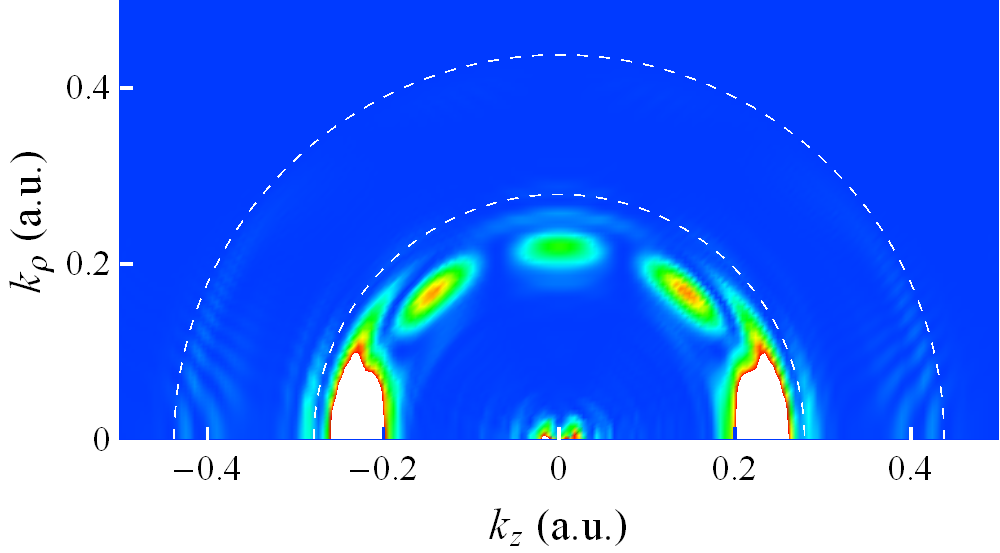
Photoelectron momentum distribution |ψ(k,t)|2 at photoionization of sodium by 57 fs laser pulse of 800 nm wavelength and 4.9 TW/cm2 peak intensity calculated at the end of laser puse. The maxima are located approximately at the semicircle of radius k = [2ϵ(0)]1/2 for the 4-photon absorption. The difference can be attributed to the dynamic Stark shift. A strong emission along the axis of laser polarization is visible, but also there are maxima at ϑ ~ 45°, ϑ = 90° and ϑ ~ 135°. The observed structure suggests that the g-wave is dominant.
References
[1] M. Z. Milošević and N. S. Simonović, Phys. Rev. A, 91, 023424 (2015)[2] A. Bunjac, D. B. Popović and N. S. Simonović, Eur. Phys. J. D: At. Mol. Clusters & Opt. Phys. 70(5), 116 (2016)
[3] A. Bunjac, D. B. Popović and N. S. Simonović, Phys. Chem. Chem. Phys., 19, 19829 (2017)
Back to the personal home page